Strategy
Search competition in US metros: what the data says about ranking difficulty
How demand, SERP composition, and local pack density shape search competition by US metro, with scoring steps and a Boston versus Phoenix example.
What to take away
- Search competition by US metro is set by buyer demand, local pack density, and the authority of pages already ranking, not by population alone.
- New York and Los Angeles carry the deepest advertiser and agency pools, so paid and organic costs run highest there.
- Mid-size metros stay winnable, but only for businesses that earn reviews and links at a steady pace.
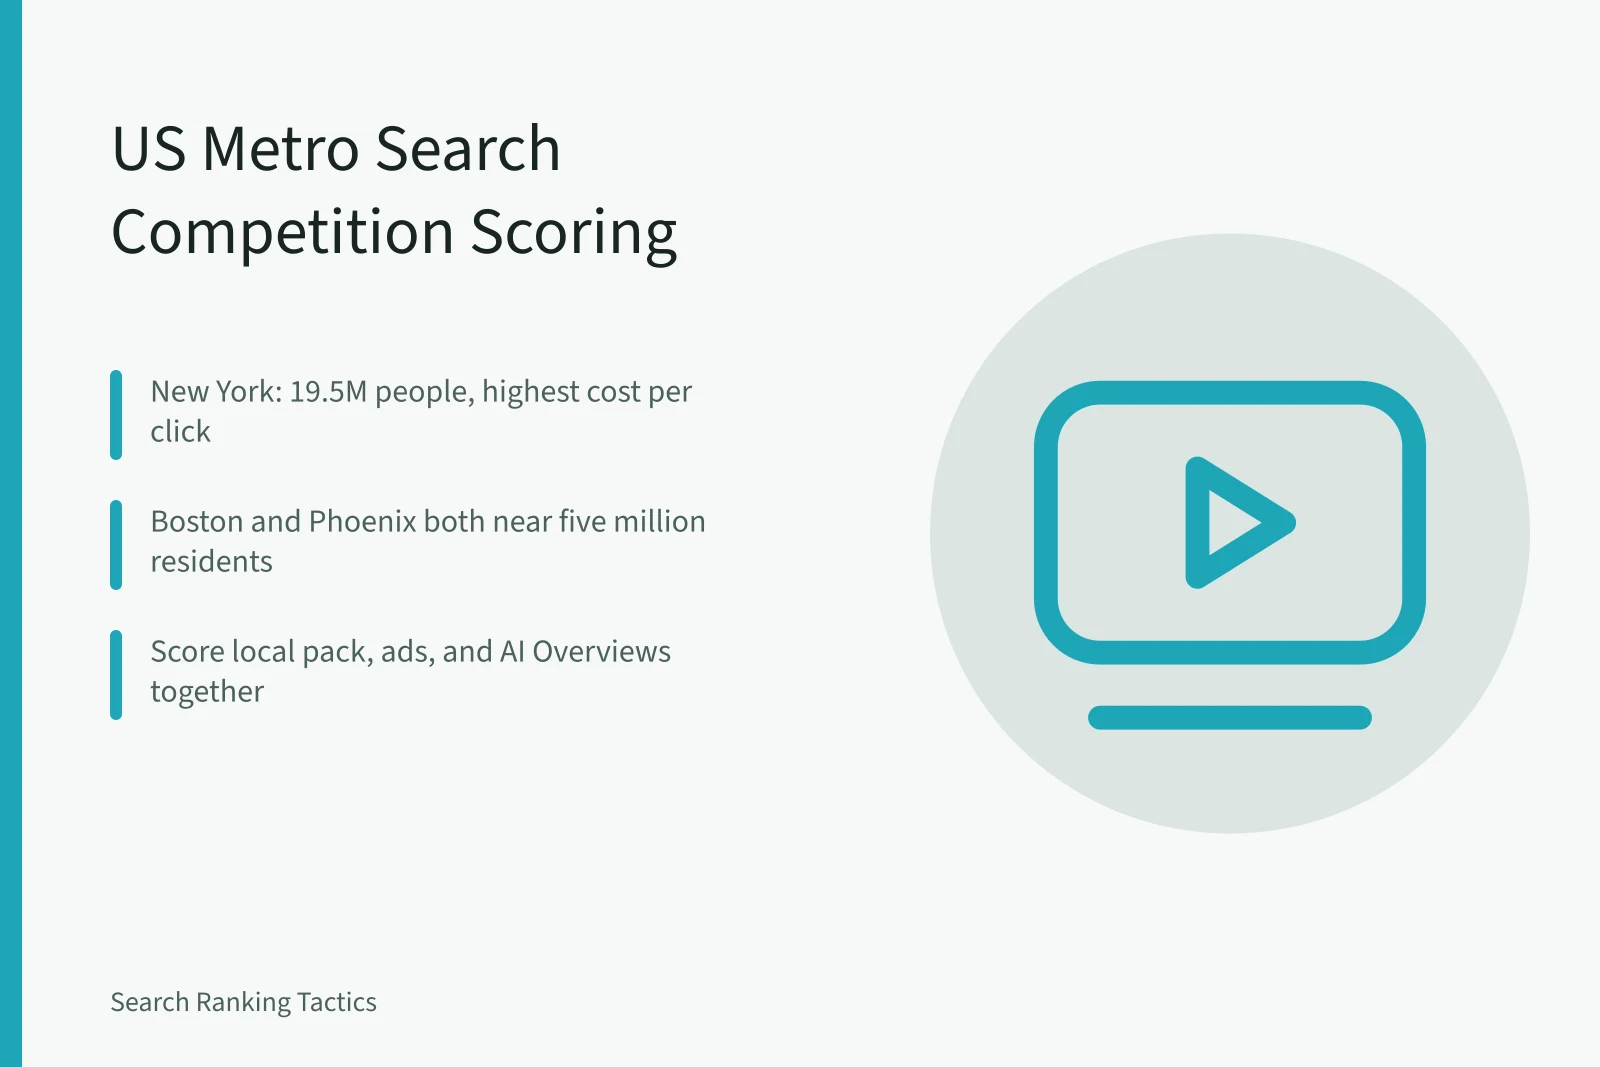
- Score the whole result page, including local pack, ads, and AI Overviews, rather than a single keyword position.
- Canadian metros follow the same logic, so one method can cover both countries.
How demand shapes search competition by US metro
Demand is the first filter. Google Keyword Planner, Semrush, Ahrefs, and Google Trends all report volume by metro, and the pattern is uneven. A metro of five million people can generate less commercial demand than a metro of two million with a dense professional sector.
Boston and Washington DC are small next to Los Angeles, yet their query sets lean toward law, health, finance, and software, where one lead carries high value. Phoenix and Las Vegas generate broader consumer demand, with more price sensitive searchers and thinner margins per click.
Search engine optimization covers technical, content, and authority work, and each of those shifts with local demand. Two metros can share a keyword and still need different page types, different proof, and different budgets.
Reading SERP composition across major US metros
Population figures come from the US Census Bureau. The difficulty column is a reading of typical SERP composition for commercial queries, not a ranking of cities.
Reading SERP composition
| Metro | Approx. metro population | Common SERP features | Difficulty signal |
|---|---|---|---|
| New York | 19.5 million | Local pack, ads, AI Overviews, news | Deepest agency pool, highest cost per click |
| Los Angeles | 12.8 million | Local pack, video, ads | Large consumer demand, heavy review counts |
| Chicago | 9.3 million | Local pack, directories, ads | Strong incumbents in most service categories |
| Dallas-Fort Worth | 8.1 million | Local pack, directories | Growing competition, uneven by suburb |
| Houston | 7.5 million | Local pack, ads, maps | Language diversity splits many keyword sets |
| Atlanta | 6.3 million | Local pack, directories, ads | High churn, frequent new entrants |
| Phoenix | 5.0 million | Local pack, ads | Broad demand, thinner per-click value |
| Boston | 4.9 million | Local pack, B2B pages, AI Overviews | High lead value, strong professional incumbents |
Example: Boston and Phoenix with similar size
Both metros sit near five million residents, and both show a local pack on most service queries. The similarity ends there.
Boston and Phoenix example
- Pull the same 20 commercial keywords for both metros in one tool, on the same date.
- Count how many top ten organic results are directories, franchises, or national brands.
- Note the review counts inside the local pack for each query.
- Compare average cost per click to estimate what one organic lead is worth.
In Boston, the top ten often holds hospitals, universities, and long established firms. In Phoenix, more of the top ten belongs to local service companies.
Consistent citations, meaning matching name, address, and phone details across listings, are a common reason one Phoenix business outranks another.
Local pack density and review counts
The local pack shows three businesses by default. In dense metros, the review counts needed to enter that trio rise sharply, and the entries change often after core updates.
A metro is not hard or easy on its own. It is a set of SERP conditions that either fit your assets or do not.
Review velocity matters more than total count in competitive metros. A business adding reviews every week can hold a pack position that a larger competitor with a static profile cannot.
Scoring a metro before you commit budget
- Pull 12 months of volume for your top 20 money terms in Google Keyword Planner.
- Count how many local pack results carry 200 or more Google reviews.
- Record how many organic top ten results are directories or national brands.
- Compare average cost per click for the same terms to value an organic position.
- Audit citations on Google Business Profile, Apple Business Connect, and Bing Places.
Run the numbers before you sign anything. A return on investment model that compares cost per lead to closed revenue will show whether a metro clears your threshold.
What carries over from Canada
Canadian metros follow the same demand logic, with extra variables. The Toronto Montreal Vancouver SEO competition comparison covers agency density, bilingual demand, cost per lead, and local pack pressure for three Canadian markets, and the same measures apply south of the border.
Turning metro data into a plan
Once the metro numbers are on the page, the honest guide to SEO strategy connects demand to crawlable architecture, original evidence, useful pages, and clear ownership.
Metro data answers where to compete. The strategy work answers what to build, who owns it, and how to release changes without losing rankings.